


11 charts to understand if inflation is peaking
All the peaks in inflation have had a major correction. Switching between inflation and deflation is more frequent than the 70s stagnation.
If inflation is a monetary phenomenon
The monetary expansion is correcting significantly. M2 is correcting from an YoY expansion of 26% in the pandemic to 8% .

M2. Source: St Louis Federal Reserve.
If inflation is about supply chains
The momentum in many commodities is decreasing.
Lumber and wood is leading the correction.
Production Index: Lumber. St Louis Federal Reserve.
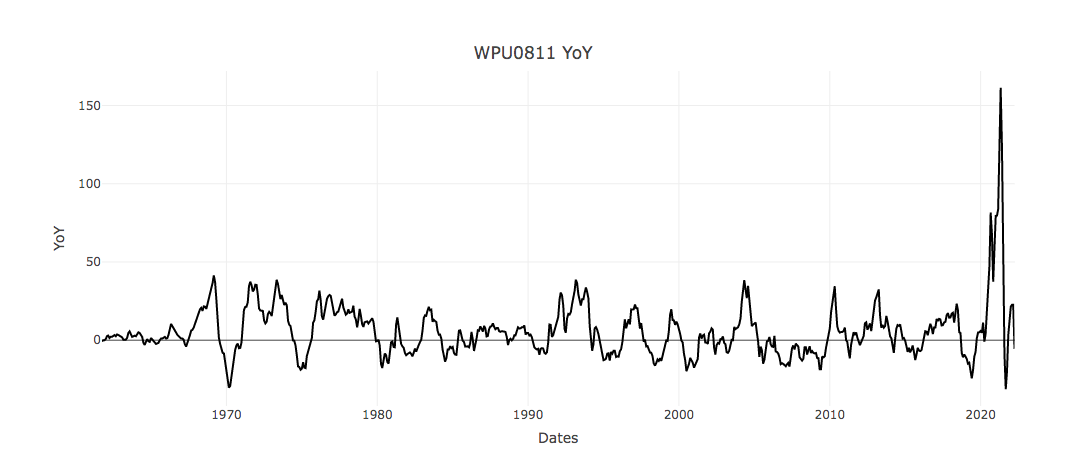
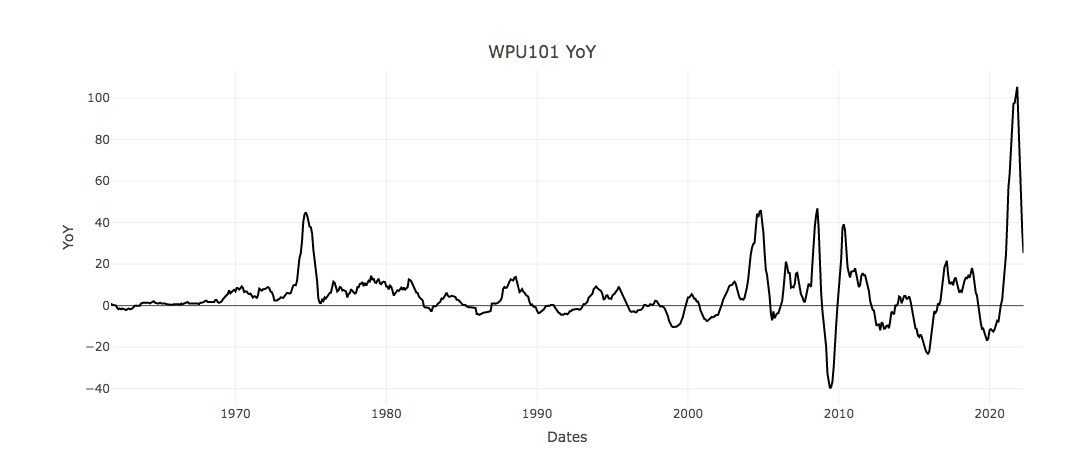
YoY variation of Steel and Iron ore is also correcting.
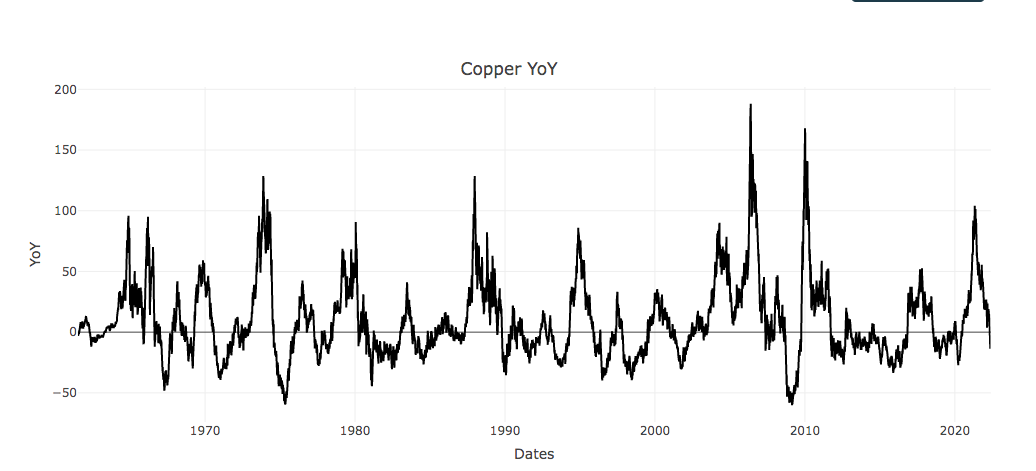
Dr. Copper is also correcting
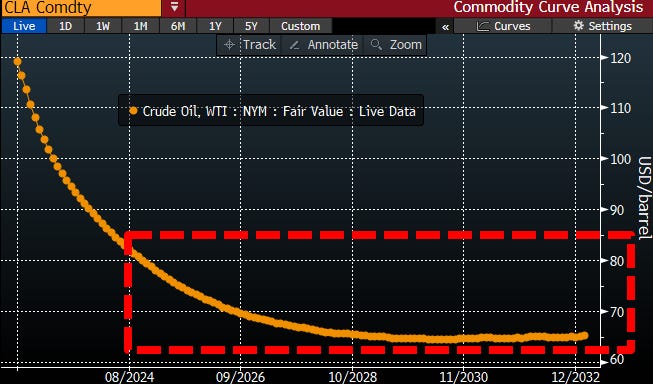
Oil is correcting slowly.

Oil futures suggesting 2024- 2026 suggesting a range between 80- 70 USD.
8. The Global Food prices index is also correcting slowly.
The last time Global Food Price Index (GFPI) YoY variation peaked was in June 2011.The food crisis was one of the factors that triggered the Arab spring. This peak happened also in the context of the war in Syria. The GFPI YoY was negative in April 2015. Currently, GFPI YoY peaked in April 2021. The Russian war in Ukraine is part of the geopolitical context of the current peak in the GFPI.

If inflation is a consumption phenomenon
9. Personal consumption is peaking

Not all inflationary processes are the same
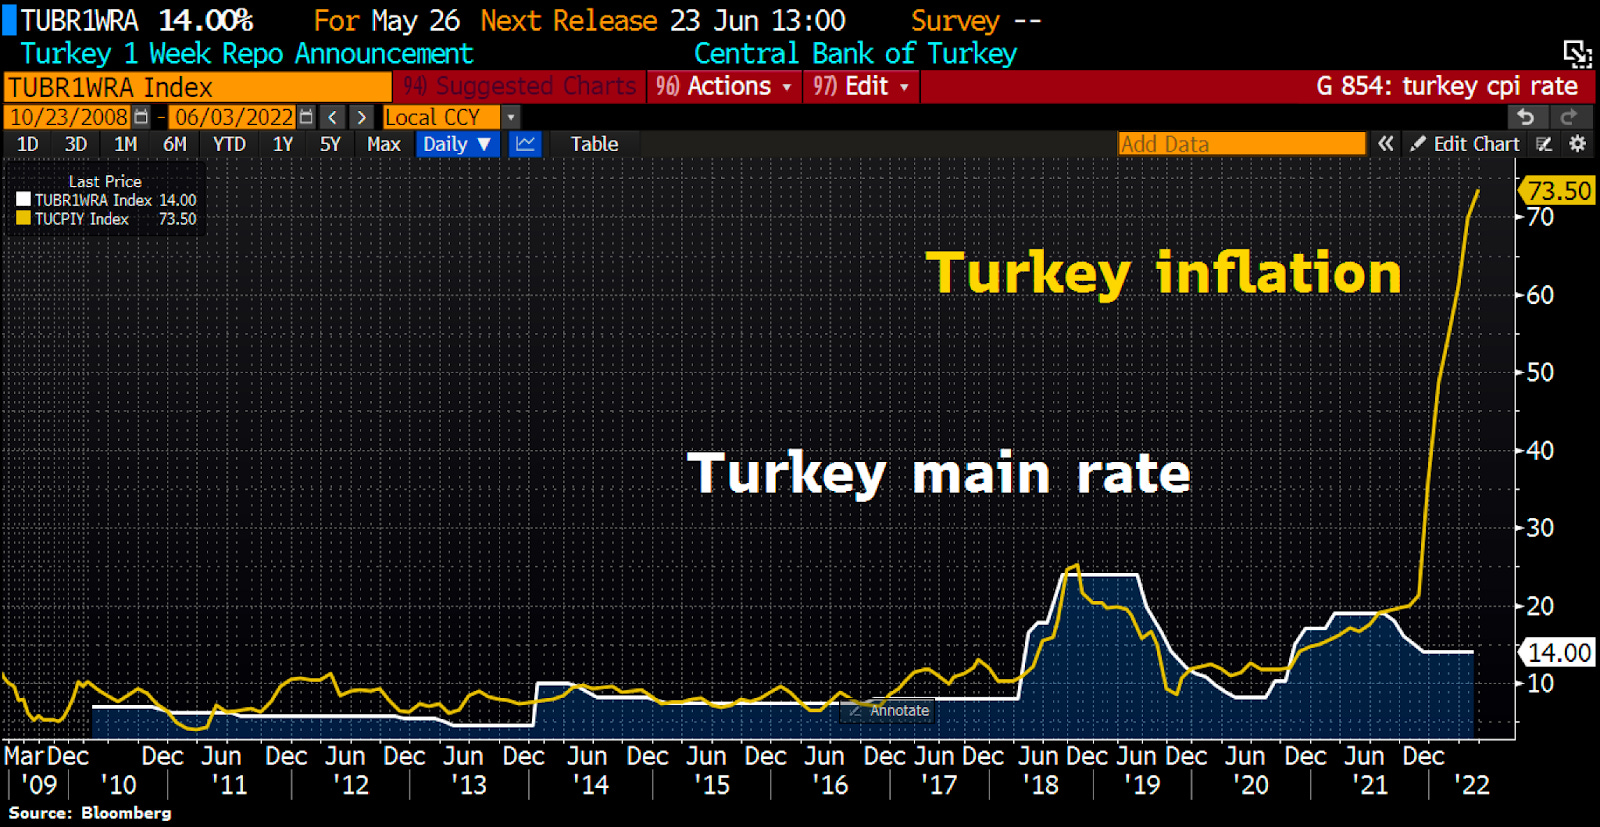
10. Some emerging markets will begin amplifying process towards hyperinflation. Turkey is one example that. At the end hyperinflation is the finger print of the autocrats.
If inflation is a historical phenomenon
11. All the peaks in inflation have had a major correction. Switching between inflation and deflation is more frequent than the 70s stagnation.
The most common analogy of the current situation is the stagflation case in 1974. However the most frequent phenomenon is the fluctuation between the narrative of high inflation and deflation.

May 1920 Inflation - July 1921 Deflation.
Feb 1934 Inflation- April 1938 Deflation.
Feb 1942 Inflation - April 1944 Des-inflation.
March 1947 Inflation- July 1949 Deflation.
March 1947 Inflation- July 1949 Deflation.
March 1951 Inflation- June 1952 Des-inflation.
June 2008 Inflation-February- 2009 Deflation
BONUS GRAPH
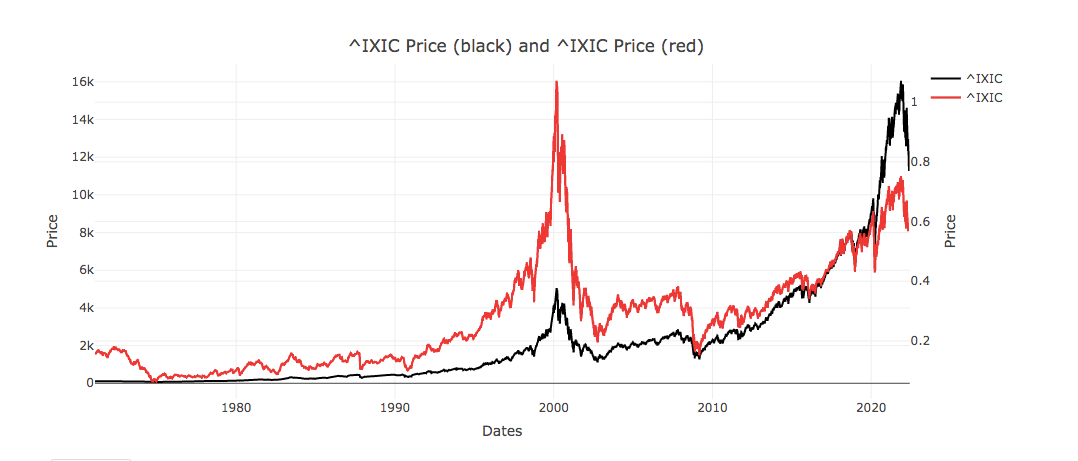
The Nasdaq without Houdini (FED)
It easy to think that everything is a bubble because the historical level of monetary expansion. So, make sense to factor the effect of the M2 by dividing the Nasdaq by M2.
Black the Nasdaq Index.
Red the Nasdaq/M2.
Have a nice weekend,
Guillermo Valencia A
June 5th, Florianópolis Brazil.
Co- founder Macrowise & Scale