
Last Week’s Gamma Squeeze: When Feedback Loops Go Parabolic
Understanding the mechanics behind the volatility spike and what it means for market structure
Last week’s market action wasn’t just another volatility event. It was a textbook example of what happens when multiple positive feedback loops synchronize, creating a gamma squeeze that forced even the most sophisticated market makers into uncomfortable positions. But beyond the tactical chaos lies a deeper structural shift that’s reshaping capital allocation across asset classes.
Let me break down what actually happened, and more importantly, what it signals.
The Tactical Breakdown: Anatomy of a Gamma Squeeze
Market Makers and the Short Gamma Trap
Market makers sit at the center of modern equity markets, providing liquidity by constantly quoting bid and ask prices. To remain delta-neutral while selling options, they hedge their exposure dynamically. This works beautifully in normal markets. But when volatility spikes and market makers find themselves collectively short gamma, their hedging activity becomes a destabilizing force.
Here’s the mechanism:
When markets rise sharply:
Market makers who sold call options are short gamma
Rising prices increase their delta exposure
They must buy more stock to remain delta-neutral
This buying pushes prices higher
Which increases their delta exposure further
Creating a self-reinforcing loop
This is exactly what we saw last week. The initial trigger doesn’t matter as much as the cascade it unleashed.
The Momentum Stack: CTA, ETFs, and VAR Models
But market makers aren’t operating in isolation. Last week’s gamma squeeze was amplified by a perfect storm of systematic strategies all moving in the same direction:
Commodity Trading Advisors (CTAs):
Trend-following algorithms detect momentum
Models signal increased long positions
Large notional flows chase performance
Further accelerating the trend
Passive ETF Flows:
Inflows must be deployed mechanically
No discretion about timing
Buying regardless of valuation
Adding fuel to the fire
VAR (Value-at-Risk) Models:
Lower realized volatility allows higher position sizes
Risk budgets expand
Leverage increases across the board
Market becomes more sensitive to any shock
Each of these operates on its own logic, but together they create correlated behavior that amplifies moves in both directions. When volatility is suppressed, they collectively build larger positions. When volatility spikes, they all attempt to reduce risk simultaneously.
The result: Markets become less efficient at price discovery precisely when you need it most.
The Structural Shift: Beyond the Tactical Noise
While traders were managing gamma exposure, something more profound was happening beneath the surface: a major rotation in how capital is being allocated.
Rotation #1: Google vs Salesforce
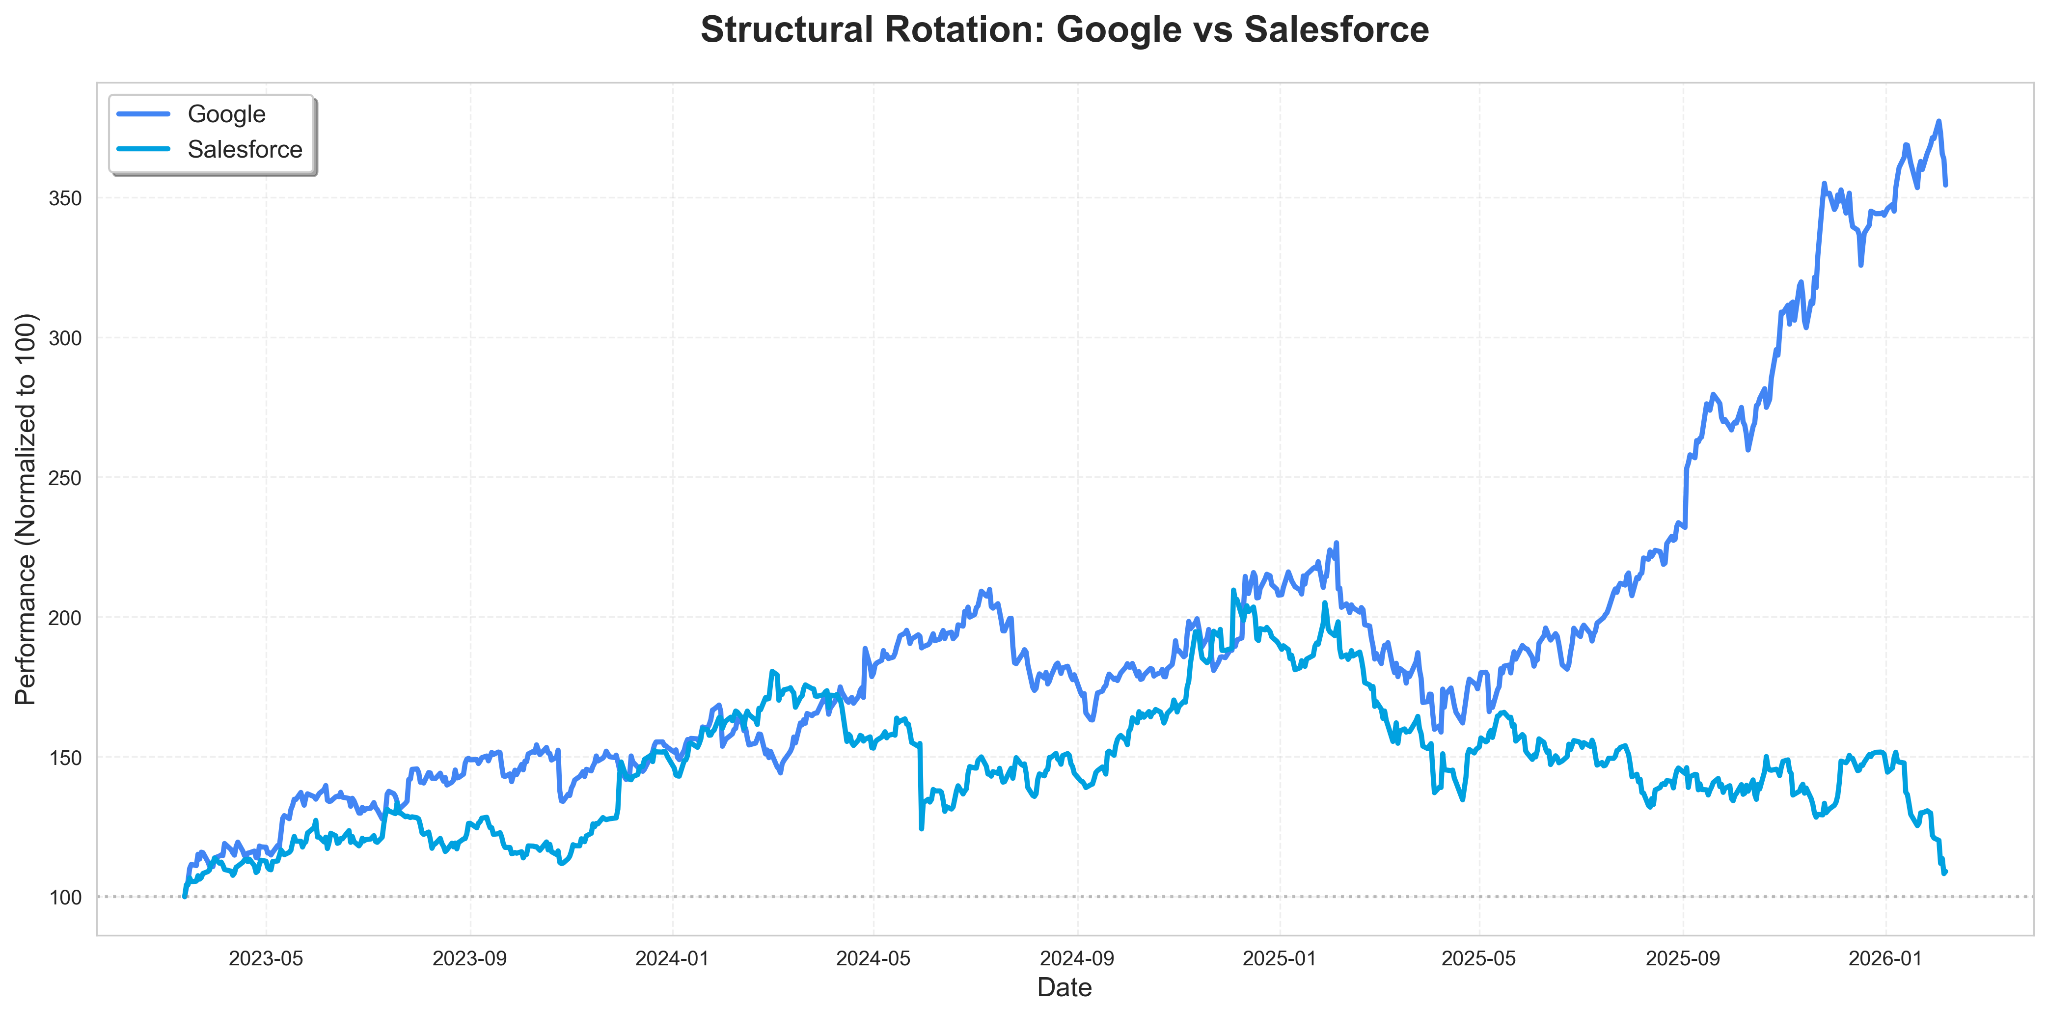
This comparison captures the changing narrative around enterprise software and cloud infrastructure.
What it shows:
Traditional SaaS models (Salesforce) facing margin compression
Infrastructure plays (Google Cloud) gaining market share
AI capabilities becoming the discriminating factor
Multiple compression in legacy enterprise software
The deeper story: The market is repricing which companies actually benefit from the AI buildout. It’s not enough to be “in tech” anymore. The market wants to see who’s building the infrastructure versus who’s just riding the wave.
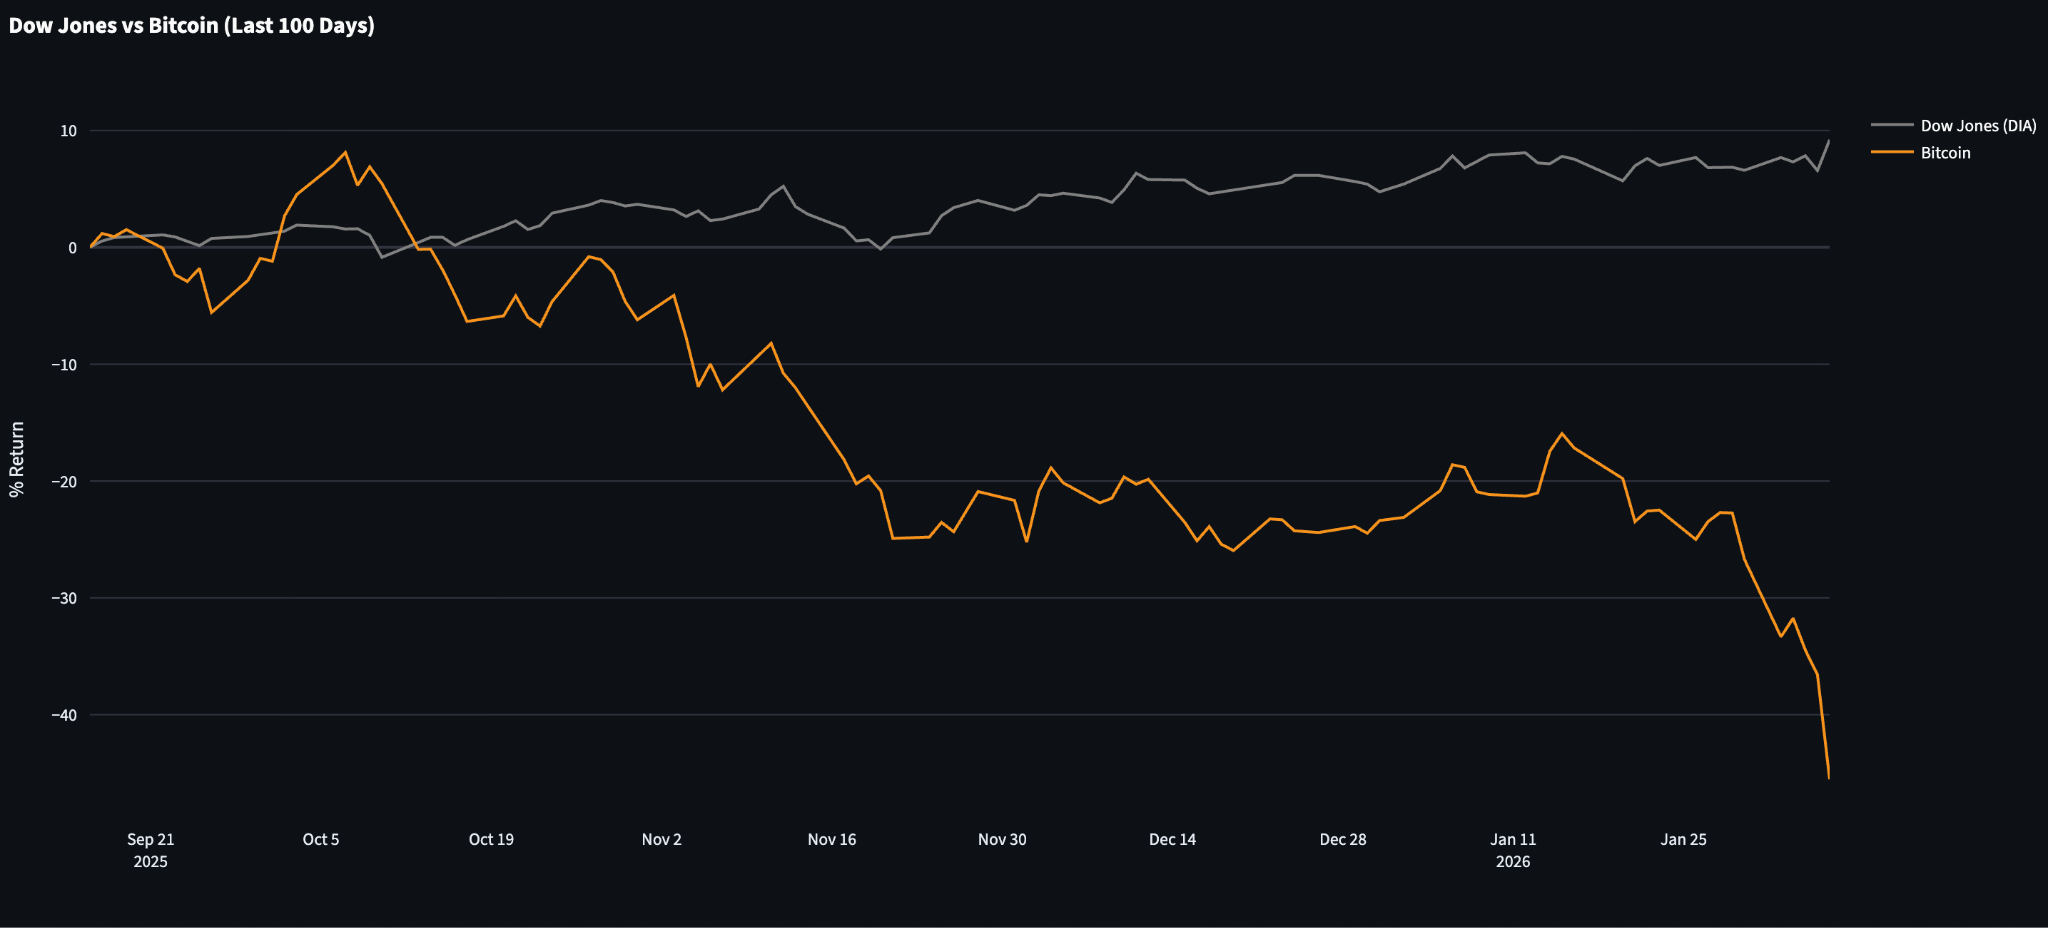
Dow Jones vs Bitcoin
The Setup: Learning Curve vs. The Opportunity
Most investors look at price levels. They ask, “Is $70k cheap?”
But the real signal isn’t about price—it’s about Time.
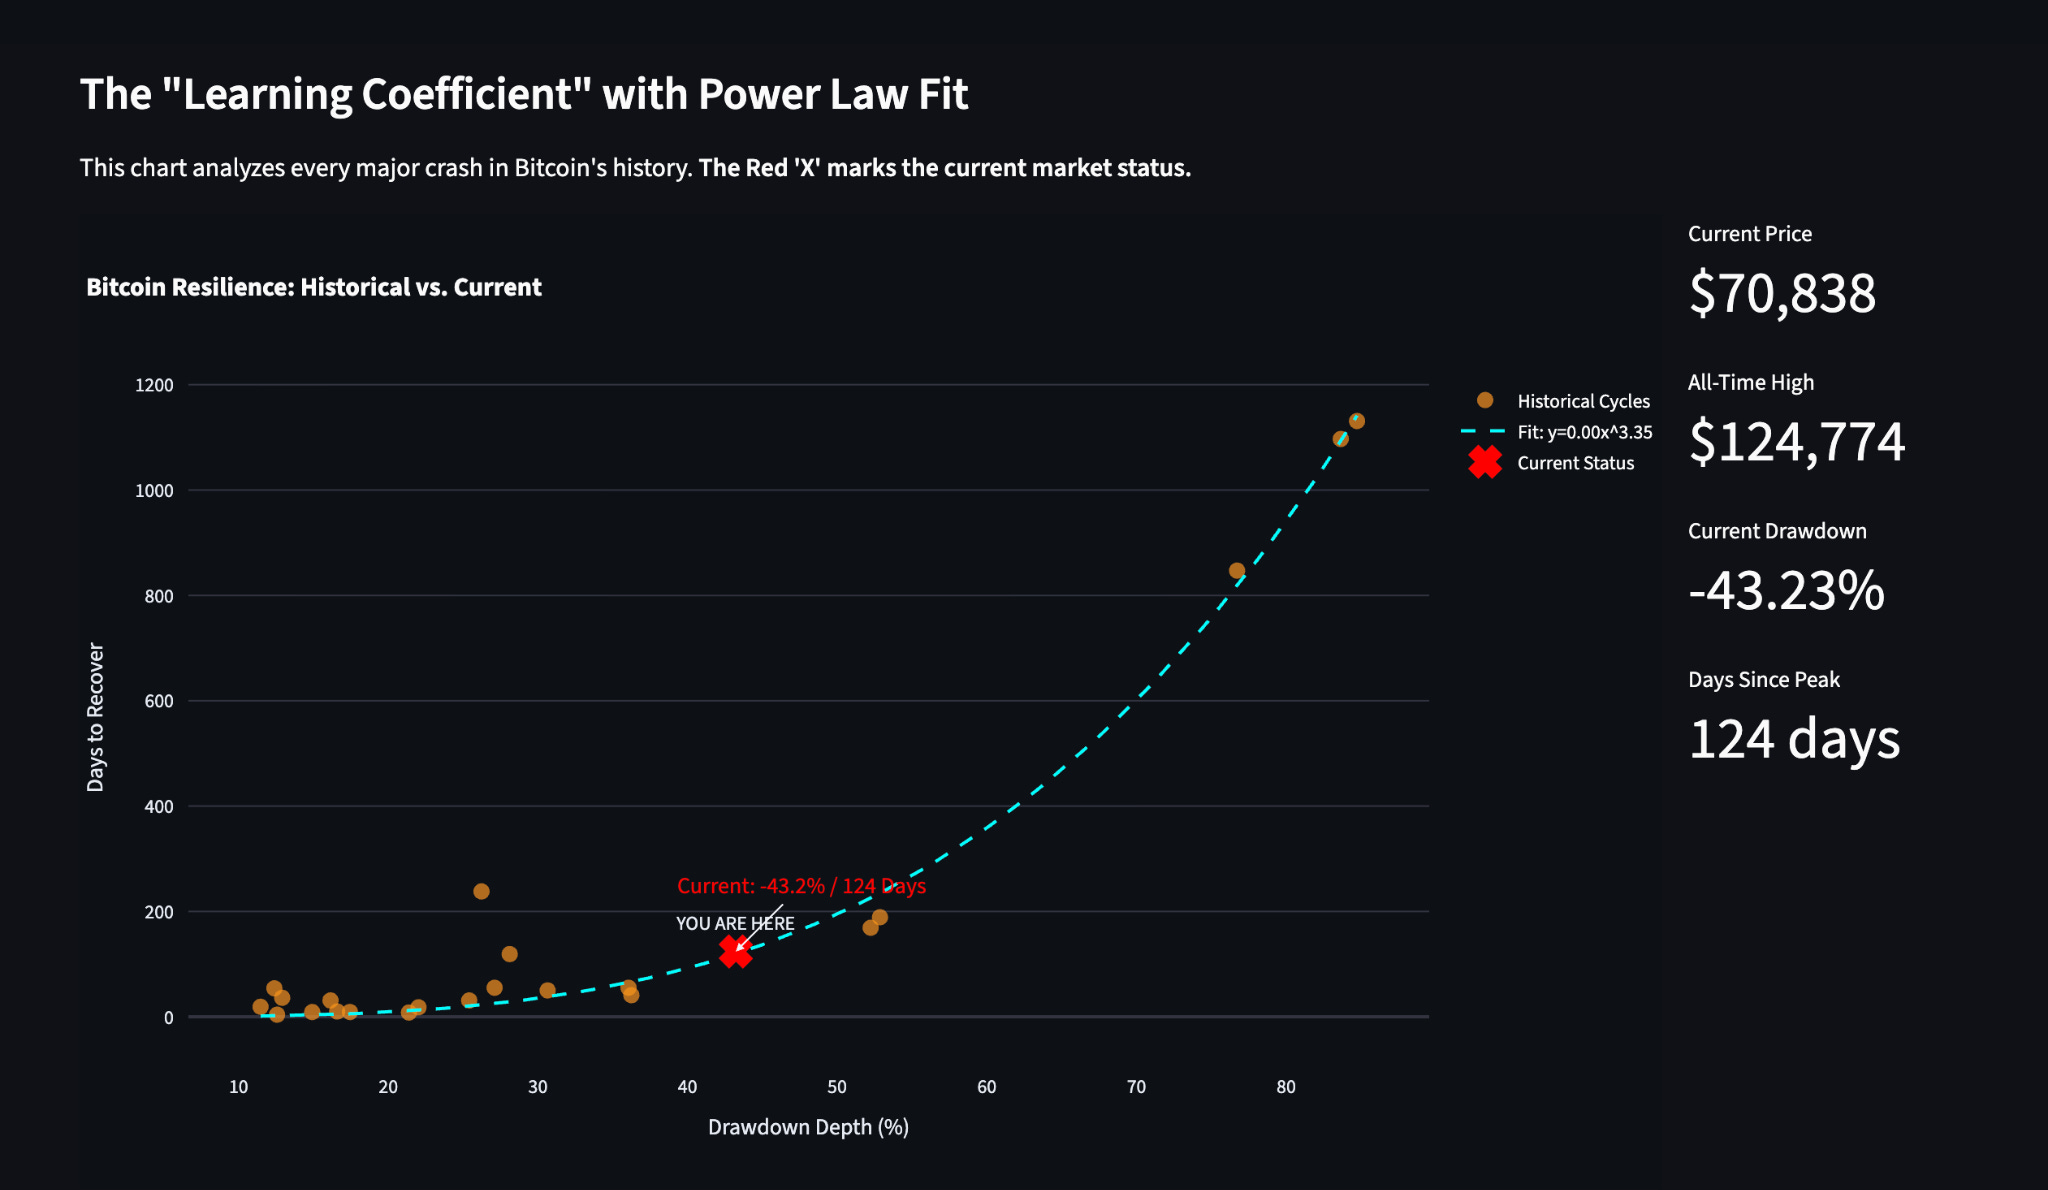
My latest model, the Bitcoin Learning Curve, plots the physics of how the market recovers from crashes. It reveals two critical insights that define the current opportunity.
1. The Learning Curve: We Are “Beating the Spread”
The blue dashed line on the chart represents Bitcoin’s historical “metabolism”—how long it typically takes to digest a crash of a certain size. It follows a Power Law: Recovery time scales exponentially with crash depth.
The History: In previous cycles (2014, 2018), the market was inefficient. Panic selling would trigger long, drawn-out “winters” where capital sat on the sidelines for 18+ months.
The Shift: Look at the Red X. We are currently in a 43% drawdown, but we are sitting below the curve.
The Insight: The market is “solving” this drawdown faster than history predicts. Why? Because the participants have changed. We aren’t waiting for retail to regain confidence; we have ETFs, sovereigns, and sophisticated arb desks front-running the recovery.
The market has “learned” that volatility is a feature, not a bug, and is bidding the liquidity holes faster than ever.
2. The Opportunity: The “Exponential Penalty” Gap
This is where the Alpha lives. The Power Law curve exposes a massive asymmetry between a “Correction” and a “Winter.”
The 40% Zone (Where We Are):
The Math: A 40% drop is the “sweet spot.” It is deep enough to flush out leverage and tourists (the “cyclical reset”), but the recovery time is measured in months. (130 days)
The Reality: This is a healthy flush. The infrastructure (miners, exchanges) remains intact.
The 70% Zone (The Danger Zone):
The Math: Once a crash crosses 60-70%, the curve goes vertical. Recovery time jumps from months to 2–3 years.
The Real Game Changer: Bank Reserves and Regulatory Shifts
Everyone talks about M2, quantitative easing, and Federal Reserve policy. But they’re looking at the wrong metric.
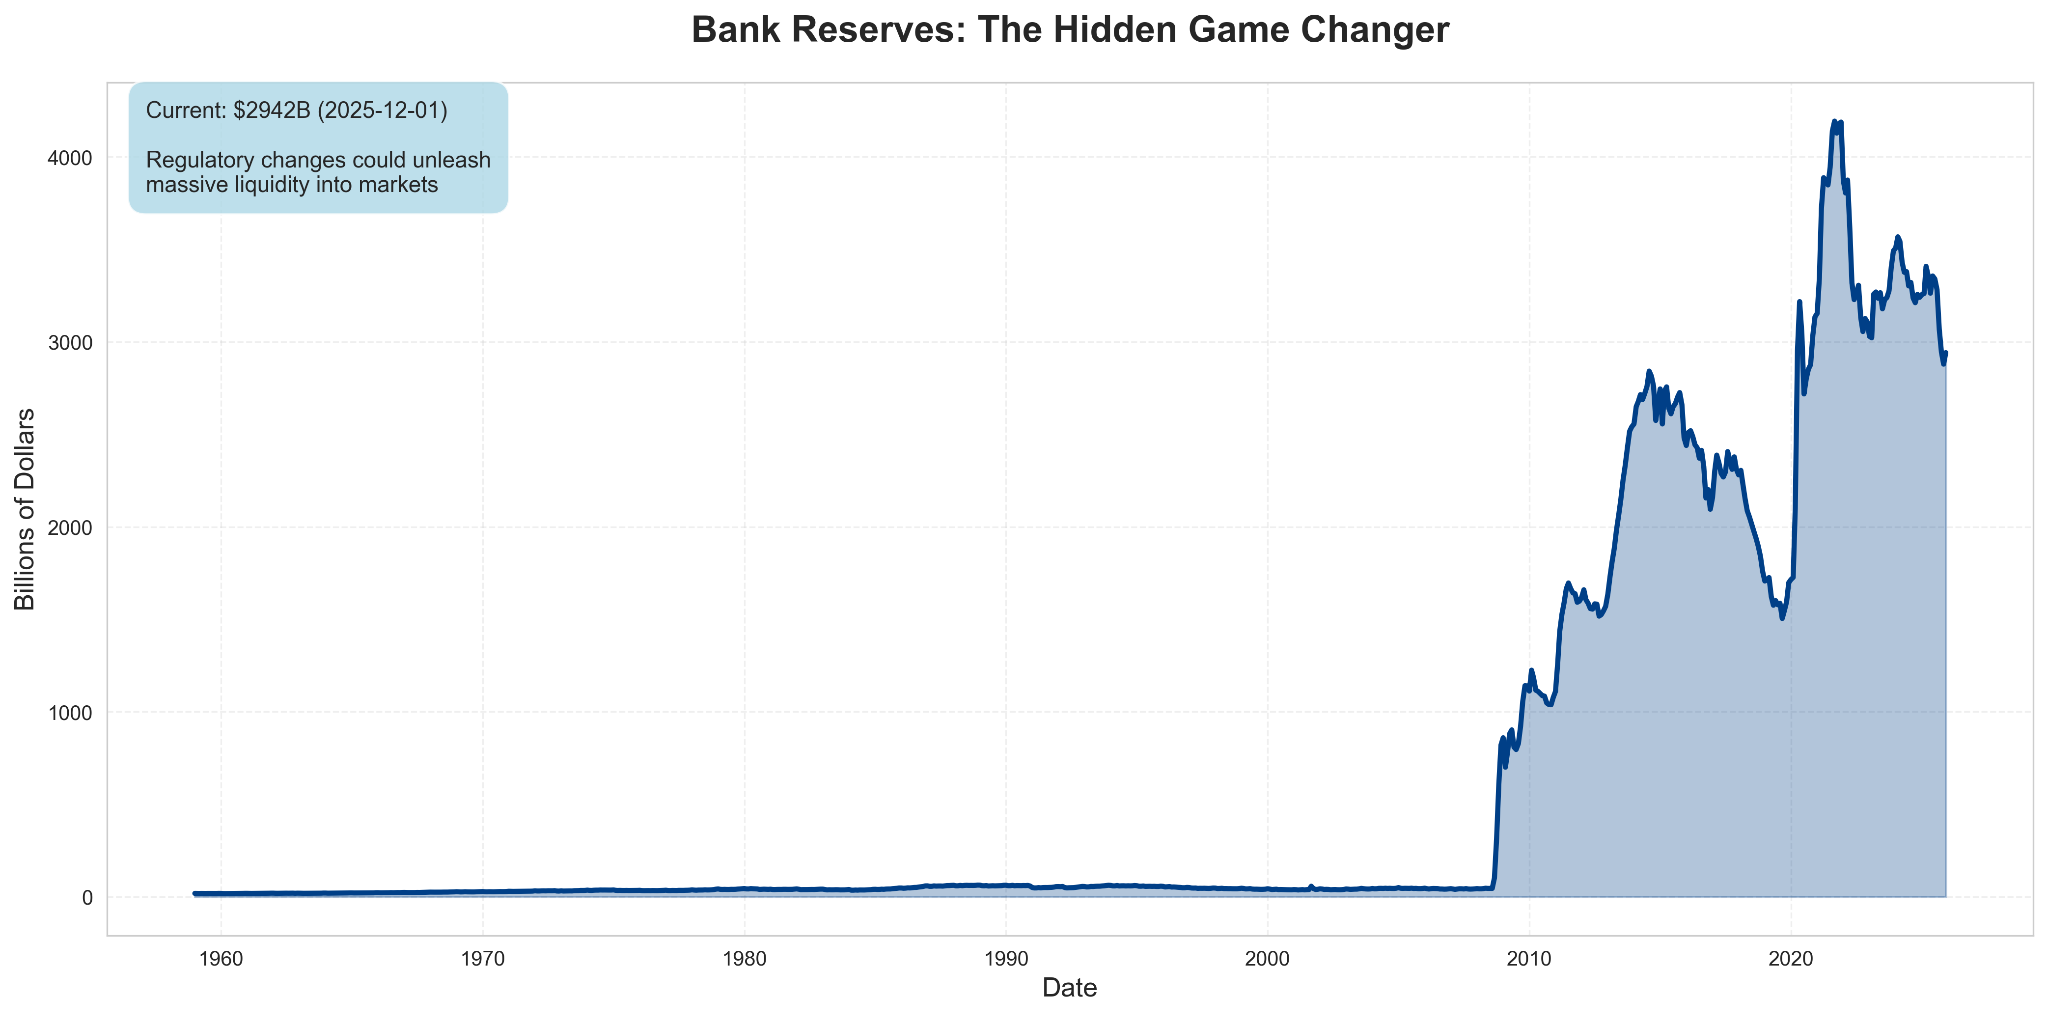
Here’s what matters: Changes in banking regulations that affect how banks can deploy their reserves.
Why Bank Reserves Matter More Than M2
Traditional view:
M2 expansion drives inflation
Fed balance sheet determines liquidity
Interest rates control capital flows
Reality:
Bank reserves are massive ($3+ trillion)
Regulatory changes can unlock this capital
This dwarfs typical Fed operations
Direct pathway to asset markets
The Mechanism
When banking regulations ease requirements for reserve holdings:
Banks gain deployment capacity - Trillions in reserves become available for lending and investment
Multiplier effects kick in - Each dollar of reserves supports multiple dollars of lending
Asset prices respond - Capital seeks yield across all asset classes
Volatility compresses - More liquidity generally means smoother markets
Until it doesn’t - When flows reverse, the impact is equally dramatic
The critical insight: This isn’t about monetary policy in the traditional sense. The Fed can keep rates steady while regulatory changes to bank reserve requirements fundamentally alter market liquidity.
Watch the regulations, not just the speeches.
Current Environment
We’re seeing subtle but important shifts:
Stress test requirements evolving
Supplementary leverage ratio adjustments being discussed
Basel III implementation timeline matters more than most realize
Regional bank consolidation changing reserve dynamics
Each of these technical changes in banking regulation has the potential to unlock hundreds of billions in deployable capital. That capital needs somewhere to go. And when it flows into markets already characterized by short gamma positioning and momentum-following algorithms, you get events like last week but in the opposite direction.
What This Means Going Forward
Short-term:
Volatility remains elevated as feedback loops unwind
Market makers will stay cautious on gamma exposure
Systematic strategies reduce position sizes
Any bounce faces immediate selling pressure
Medium-term:
Structural rotations continue (AI infrastructure > legacy SaaS)
Digital assets gain as sovereign debt concerns mount
Learning coefficients improve for quality names
Drawdowns get bought more aggressively
Long-term:
Bank reserve regulatory changes provide the real liquidity driver
This matters more than traditional Fed policy
Capital flows increasingly bifurcate (winners win bigger)
Volatility clustering becomes the norm, not the exception
The Takeaway
The market isn’t broken. It’s evolving. Understanding the difference between tactical volatility and structural rotation is what separates signal from noise.
And right now, the signal is clear: Capital is rotating toward companies and assets positioned for the next decade, not the last one. The feedback loops will settle. The rotations will continue.
Kind regards,
Guillermo Valencia A
Muchas gracias por el articulo Guillermo, como siempre, información top.
Muy bueno 👏🏼👏🏼👏🏼