


The Noise of Trade Wars and the Signal of History
U.S. equity markets bend but don’t break—at least they didn’t in Trump 1.0. The structural risk isn’t in Silicon Valley or Wall Street, not yet. The risk is in Emerging Markets.
Right now, the world feels loud. Tariffs, Trump, trade wars—it’s a cacophony of headlines screaming about economic doom. You’ve got pundits tossing around terms like “depression” and “19th-century protectionism,” as if we’re one policy blunder away from horse-drawn carriages and bread lines. The Drs. Doom are out in full force, painting a picture of a Nasdaq bubble ready to pop and a global economy teetering on the edge. It’s hard not to get swept up in it. The noise is deafening.
But here’s the thing about noise: it’s seductive. It grabs your attention, floods your brain with the latest data point, and tricks you into thinking the sky is falling. Cognitive bias—availability bias, to be exact—kicks in, and suddenly all we can see is the tariff announcement or the tweet du jour. We lose the forest for the trees. So let’s step back, take a breath, and look at what actually happened during Trump’s first trade war period—Trump 1.0 (2017-2021)—and what the early days of Trump 2.0 (2025 onward) are showing us in other markets. The charts I’ve included, along with recent data, tell a story that cuts through the clutter.
The Trade Wars: Volatility Returns
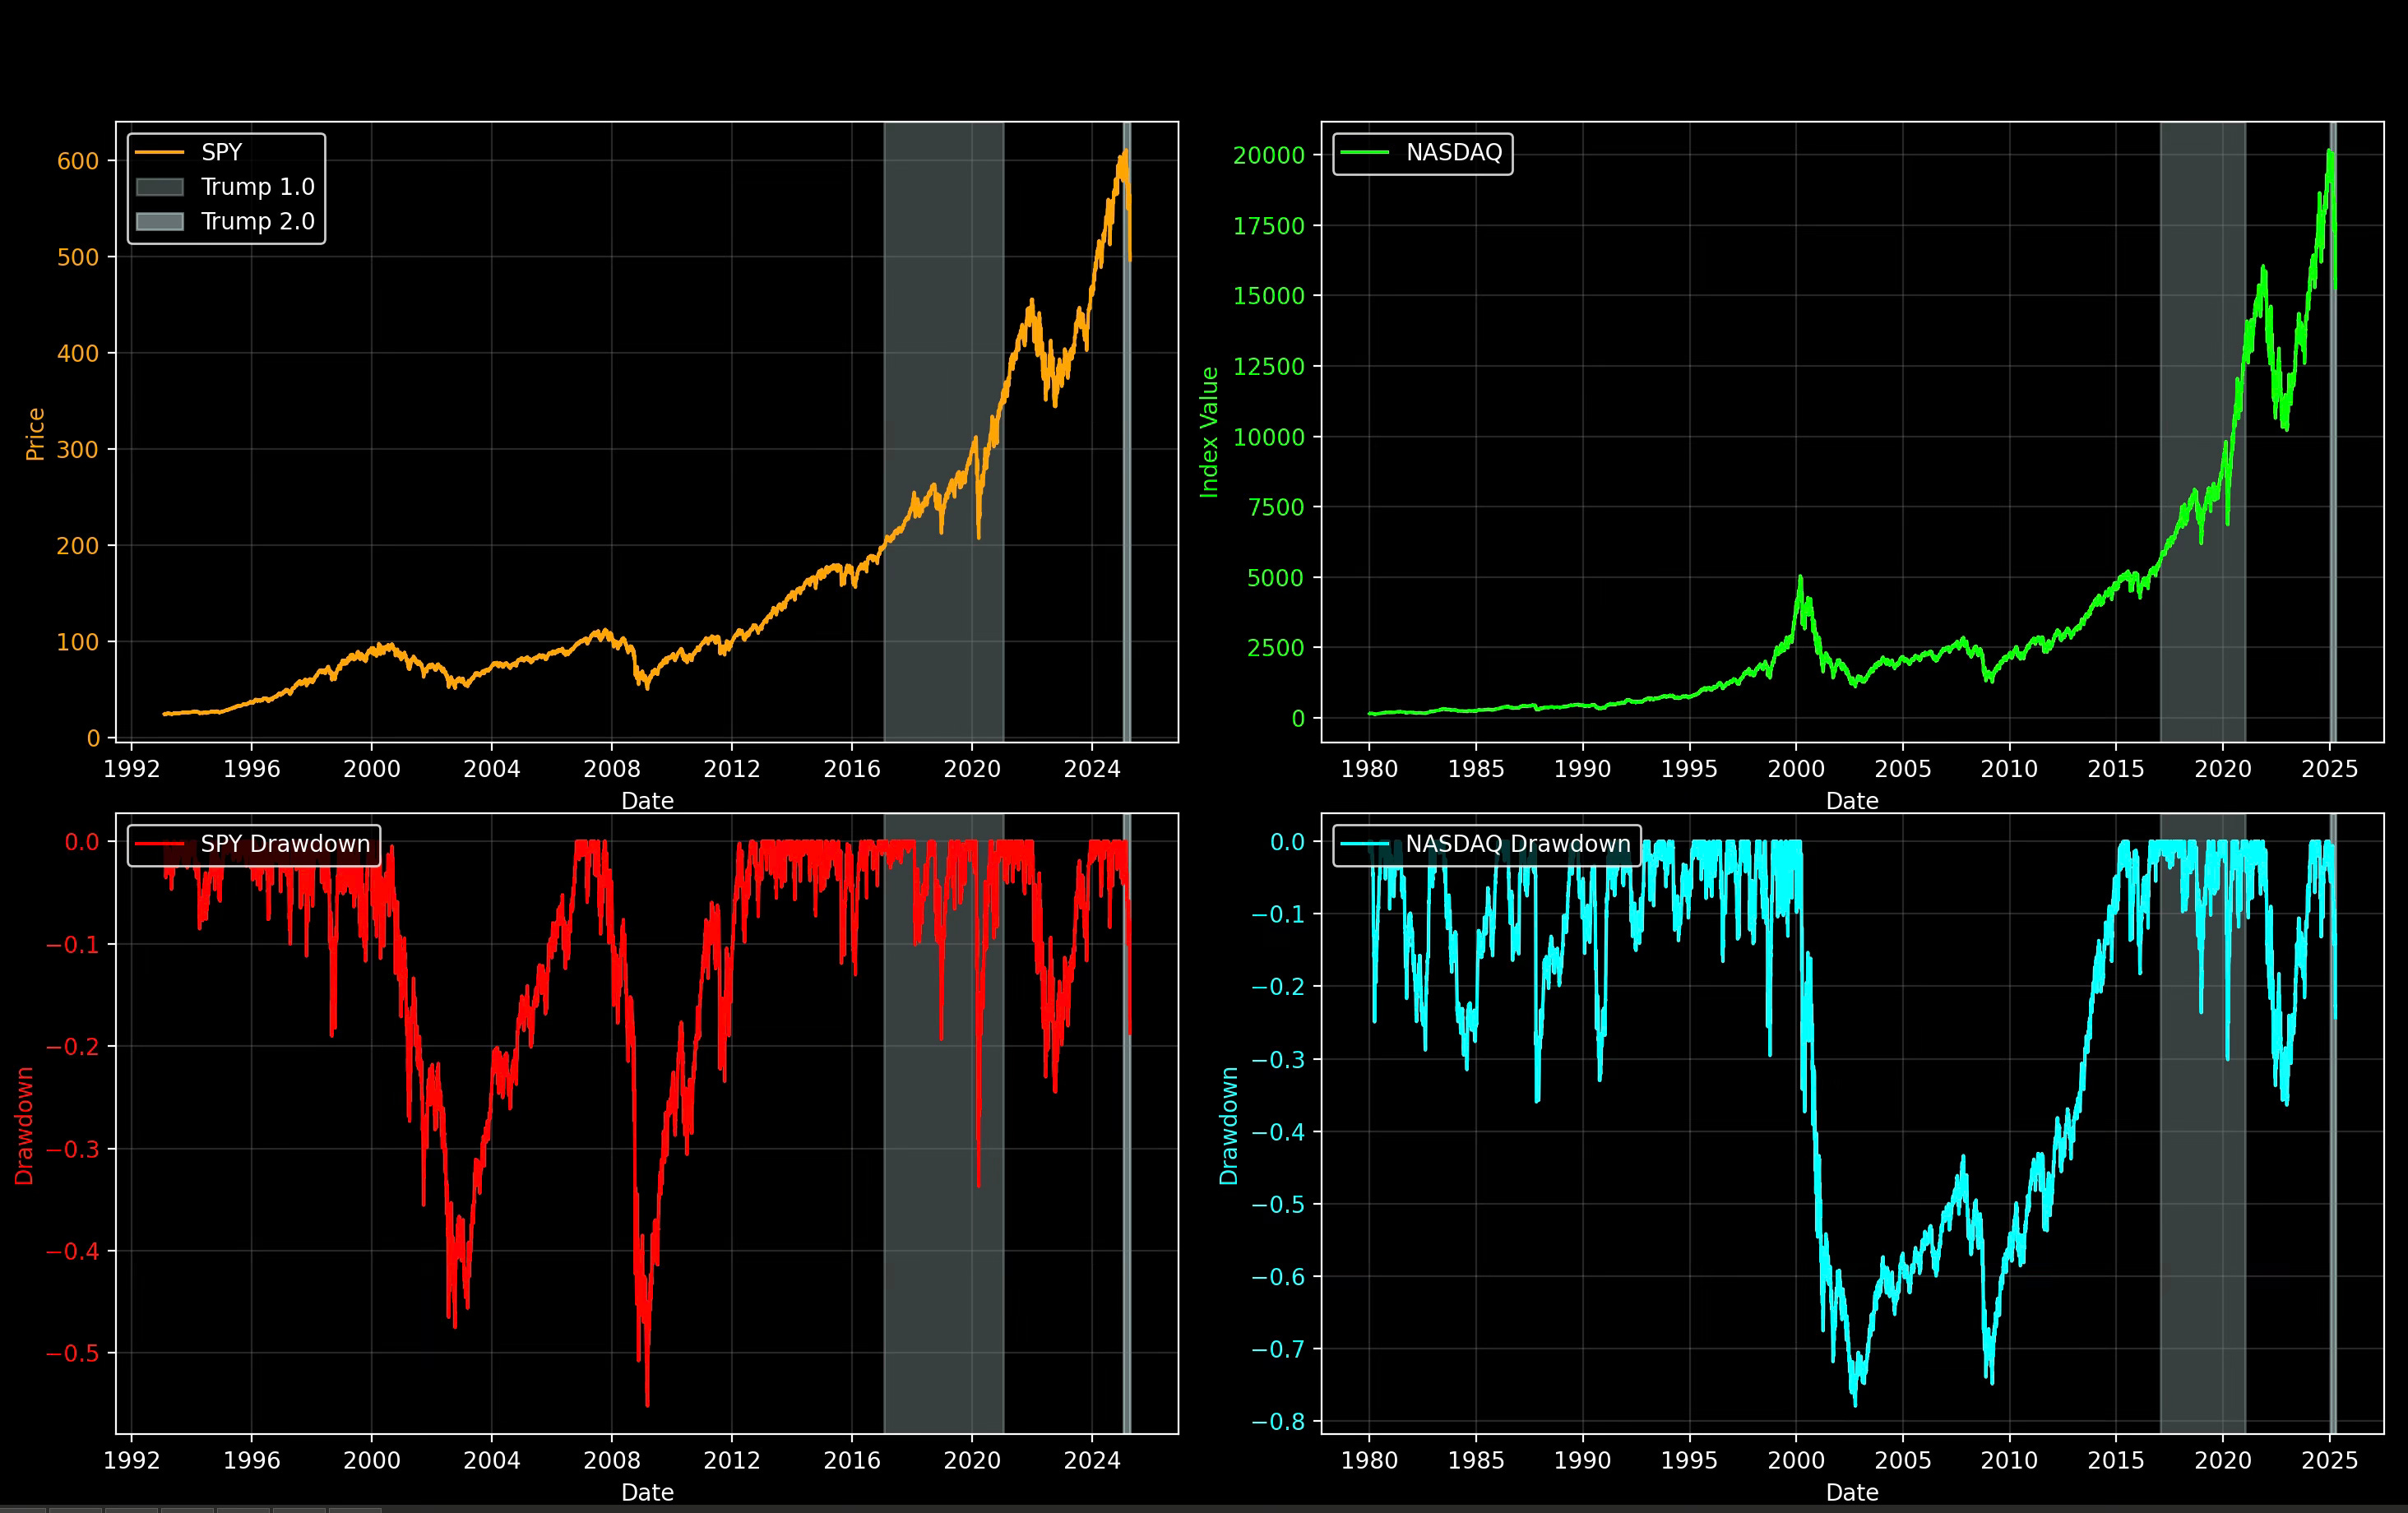
Let’s start with the U.S. equity markets, because that’s where the loudest doomsayers are pointing. The first set of charts shows the S&P 500 (SPY) and Nasdaq during Trump’s terms, with their respective drawdowns underneath. The SPY chart, on the left, tracks the index during Trump 1.0 (2017-2021) and Trump 2.0 (2025 onward), shaded in gray. In Trump 1.0, the SPY starts at around 240 in early 2017 and climbs to 380 by early 2021, a 58% gain. The drawdown chart below shows two sharp dips: around 20% in late 2018, when trade tensions with China peaked, and another 30% during the 2020 COVID crash. In Trump 2.0, starting in 2025, the SPY peaks at 600 but then takes a hit. The drawdown chart shows a 20% drop in early 2025, reflecting the renewed trade war fears and market jitters as Trump 2.0 policies take shape.
Perspective!
The Nasdaq chart on the right follows a similar pattern during these periods. In Trump 1.0, the Nasdaq rises from 6,000 in early 2017 to 13,000 by early 2021—a 116% surge. The drawdowns below reveal the volatility: a 20% dip in late 2018 and a 30% drop in 2020, mirroring the SPY’s turbulence. In Trump 2.0, the Nasdaq peaks at 20,000 in early 2025, but the drawdown chart shows a 20% decline shortly after, aligning with the SPY’s drop as trade war rhetoric heats up again. Both indices took hits during Trump 1.0 but recovered to new highs. In Trump 2.0, the 20% drawdowns signal that volatility is back, and the markets are feeling the pressure.
The takeaway? U.S. equity markets bend but don’t break—at least they didn’t in Trump 1.0. The structural risk isn’t in Silicon Valley or Wall Street, not yet. But Trump 2.0 is showing us that the trade wars can still bite, with 20% drawdowns in both the SPY and Nasdaq right out of the gate.
The Dollar’s Tale: A Warning from Trump 1.0
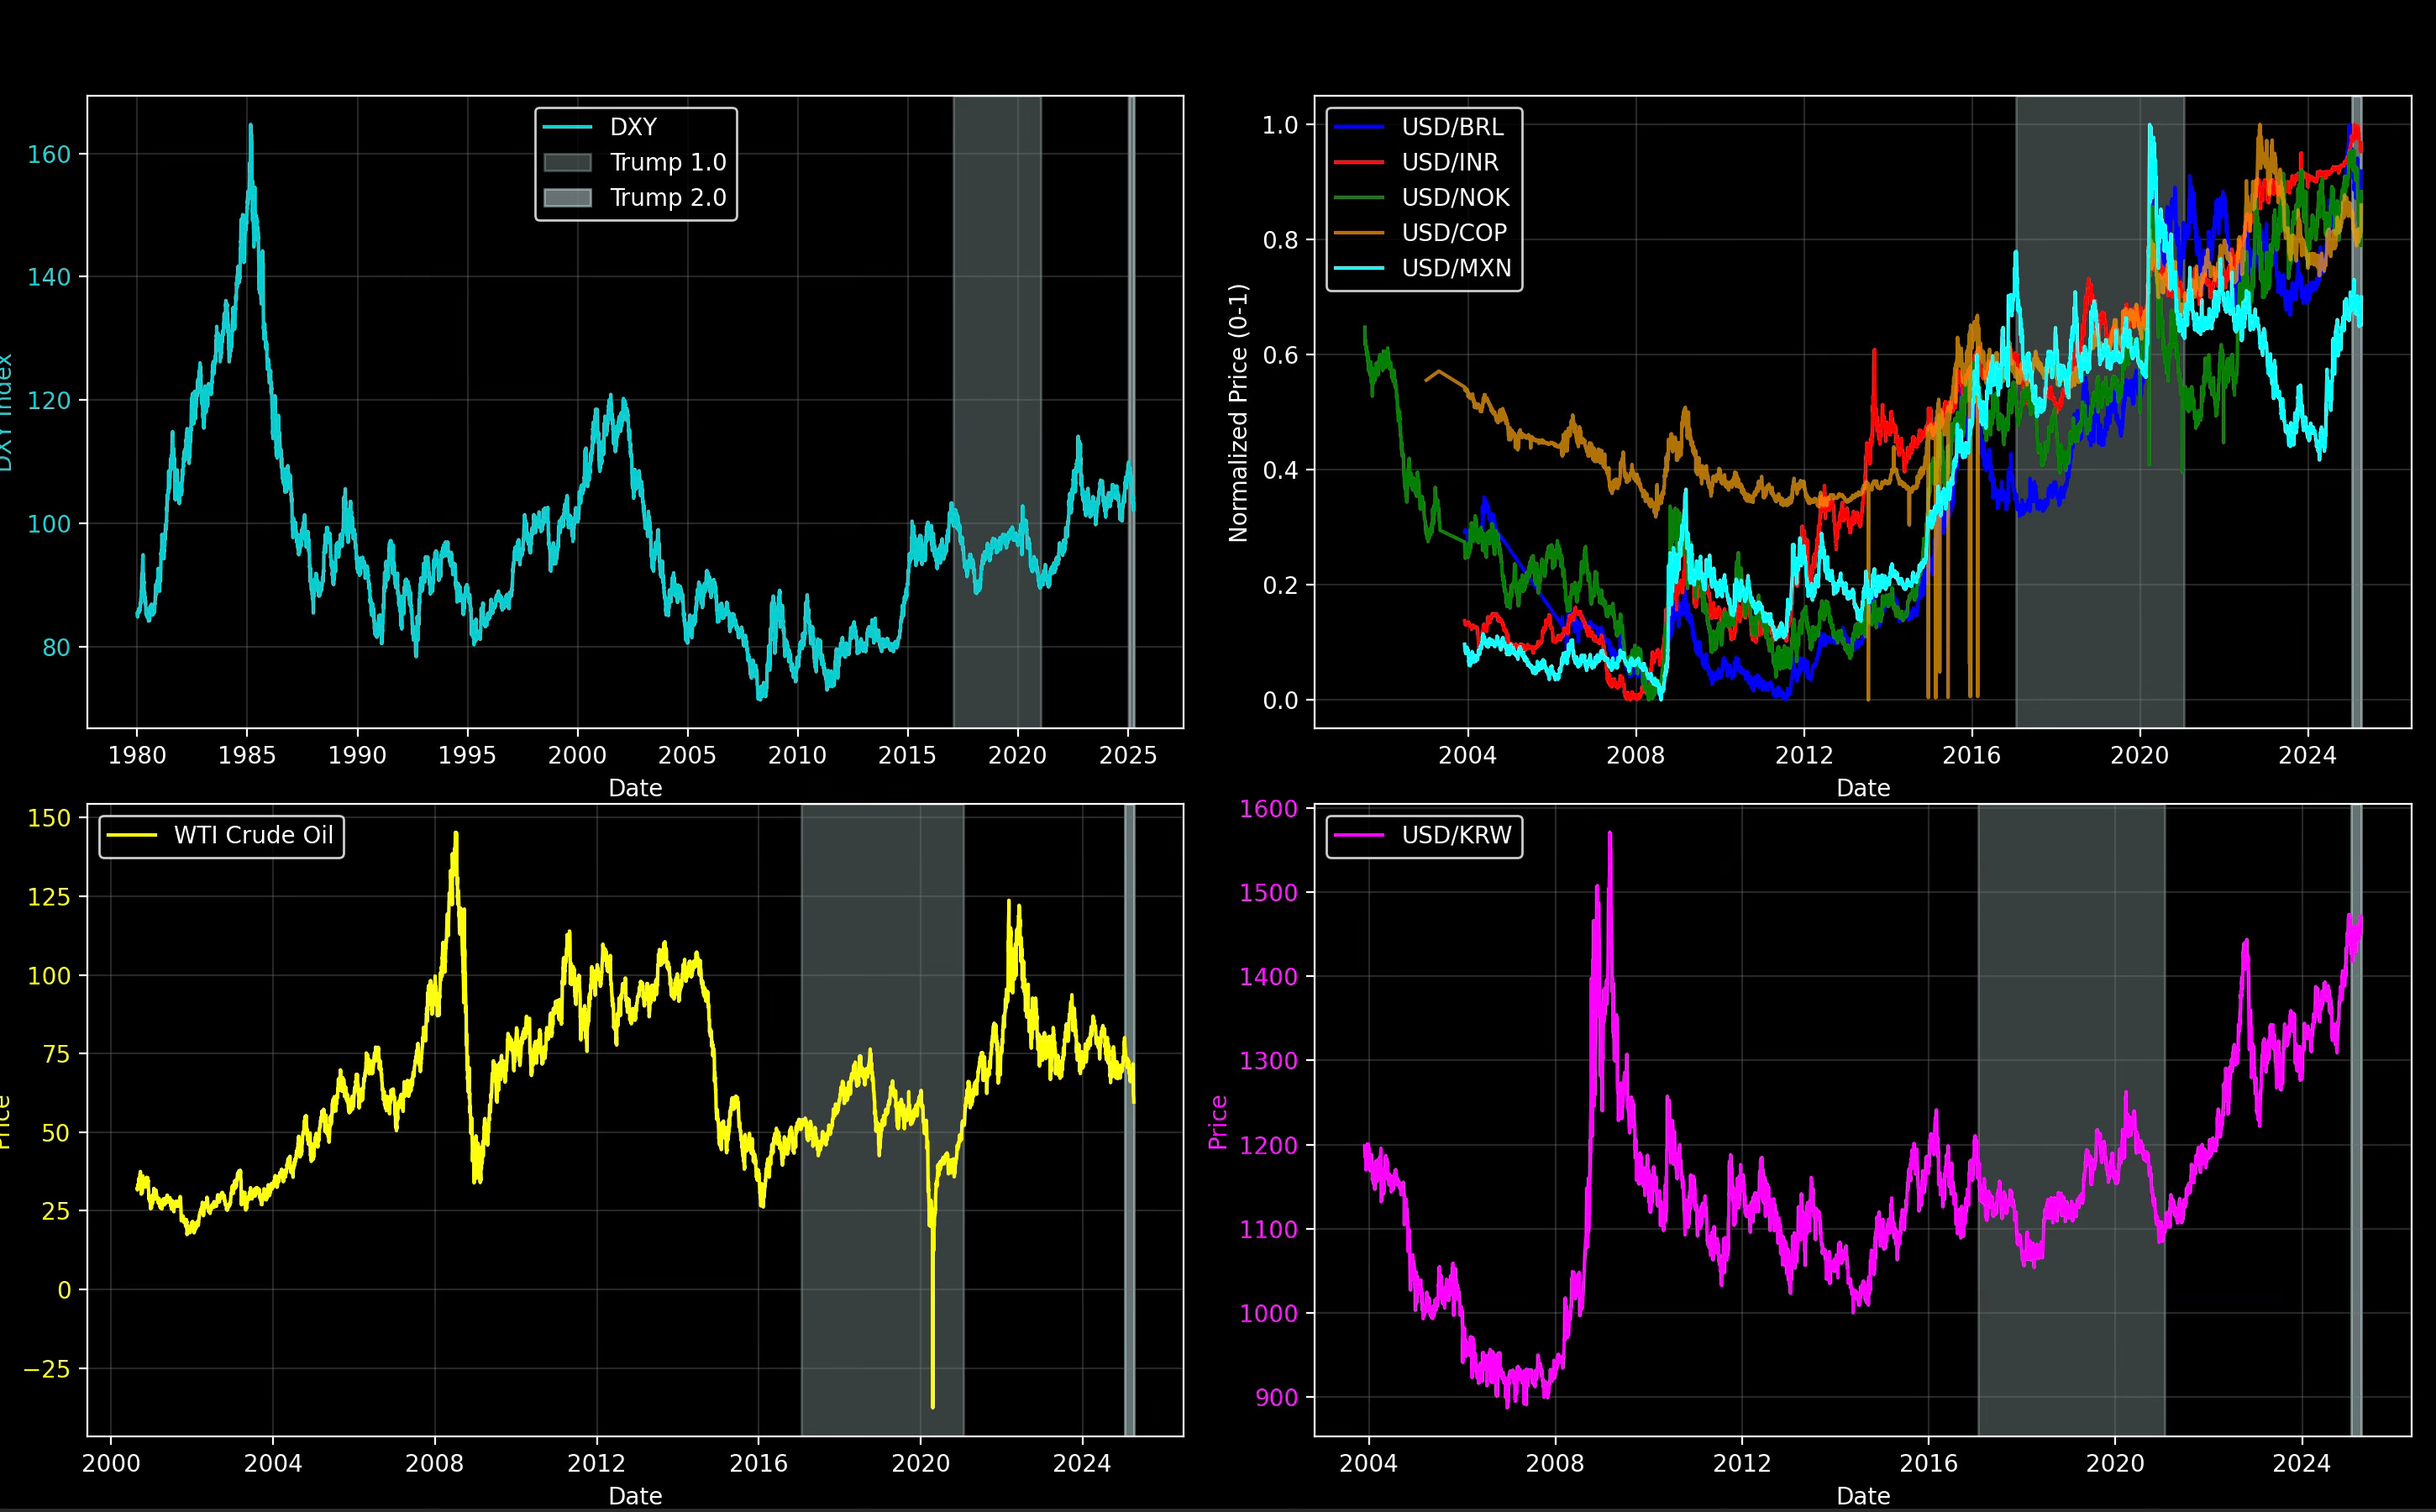
Now let’s shift gears to currencies, where the real damage often hides, and look at what happened during Trump 1.0 to see what might lie ahead. The third set of charts dives into the dollar’s strength during that trade war period. The top left graph shows the DXY—the dollar index against a basket of major currencies—during Trump 1.0. From 2017 to 2021, the DXY trades in a tight range, starting at 100 in 2017, dipping to 90 in 2018, and ending around 90 by 2021. Against heavyweights like the euro and yen, the dollar didn’t go haywire during the trade wars—it stayed steady, almost bored.
Contrast that with emerging market (EM) currencies, shown in the top right chart, which tracks the dollar against the Brazilian real (BRL), Indian rupee (INR), Colombian peso (COP), and Mexican peso (MXN) from 2017 to 2021, normalized for comparison. During Trump 1.0, the dollar surges against these currencies. The USD/MXN (cyan) and USD/COP (yellow) climb sharply, reflecting 20-40% devaluations, while the USD/BRL (blue) and USD/INR (red) trend down more gradually but still lose ground. The trade wars fueled a strong dollar, and emerging markets felt the pain. The bottom right chart, showing the USD/KRW (South Korean won) from 2017 to 2021, reinforces this. The won weakens significantly—the exchange rate jumps from 1,100 in 2017 to 1,500 by 2020, a 30% devaluation.
What does this tell us? In Trump 1.0, the dollar’s stability against major currencies masked a brutal reality for emerging markets. The trade wars created a strong dollar environment, and EM currencies bore the brunt, devaluing 20-40% as capital fled to the safety of the U.S. If this pattern repeats with Trump 2.0’s trade wars, we could see a very strong dollar against EM currencies again. Countries like Mexico, Brazil, Colombia, and South Korea could face renewed pressure, with their currencies taking a significant hit as investors seek the safety of the dollar amid global uncertainty. That’s a risk worth watching as Trump 2.0 unfolds.
Perspective!
Currency Wars and the Looming Offshore Liquidity Crisis: The Bigger Losers Don't Have a Reserve Currency

A pervasive anxiety over specific events seizes the main narrative, casting a shadow over collective judgment. We are in the middle of a currency war. The depreciation of the yen was just the beginning. Europe, especially Germany, is the most affected by this depreciation.
Oil and the Game of Low Growth
The updated chart brings us to oil—WTI Crude, to be exact—covering Trump 1.0 and the early months of Trump 2.0. During Trump 1.0, prices start at around $50 in early 2017, rise to $70 by late 2018, then crash to $20 by April 2020 as trade wars stoke fears of slower global growth, compounded by the COVID demand shock. Prices briefly dip below zero in April 2020—a historic anomaly—before recovering to $40 by early 2021. In Trump 2.0, the chart shows prices starting at around $80 in January 2025, peaking near $85 in early 2025, and then plummeting to $63.83 by April 2025—a 25% drop from the peak. This sharp decline aligns with reports of OPEC+ increasing output and Trump’s new tariffs exacerbating demand fears.
Now, let’s unpack the game theory behind these swings, because oil isn’t just a commodity—it’s a battlefield. Trade wars, by their nature, signal weaker global growth. When growth slows, demand for oil softens. For Saudi Arabia, the world’s swing producer, this is a moment of strategic calculation. They’ve got low production costs—around $10 per barrel—compared to, say, U.S. shale producers, who need $40-50 to break even, or heavily indebted players like Venezuela, who are already on the ropes. If Saudi Arabia sees demand weakening, like during Trump 1.0’s trade wars, they have a clear incentive: flood the market with cheap oil, drive prices down, and bankrupt high-cost competitors to retain market share.
Here’s how it played out in Trump 1.0. In 2018, as trade tensions escalated, oil prices were at $70. But by 2020, with growth fears mounting, prices collapsed to $20—and briefly to negative territory—partly because Saudi Arabia opened the taps in a price war with Russia. The Saudis weren’t just reacting to demand; they were playing offense. They knew a price collapse would hurt U.S. shale producers, many of whom were leveraged to the hilt, and push out weaker players like Venezuela, whose state-owned oil company, PDVSA, was already drowning in debt with over $60 billion in liabilities by 2020. By driving prices below the breakeven point for these competitors, Saudi Arabia could squeeze them out of the market, ensuring their own dominance when demand eventually recovered.
But Venezuela isn’t the only one in trouble. Other oil players could face serious pain if Saudi Arabia repeats this strategy in Trump 2.0. Take Nigeria, for instance—Africa’s largest oil producer. Nigeria relies on oil for over 90% of its export revenue, but its production costs are high, often around $30-40 per barrel due to aging infrastructure and security issues in the Niger Delta. A price collapse to $30 or below would crush their budget, especially with a debt-to-GDP ratio already above 40% in 2024. Colombia faces a similar risk. Oil accounts for about 50% of its export revenue, and production costs are around $35-40 per barrel due to challenging terrain and aging fields. With a fiscal deficit of 5.5% of GDP in 2024, a price drop to $30 would severely strain its economy, potentially leading to currency devaluation and social unrest. Brazil, too, is vulnerable. While Petrobras has lowered its breakeven costs to around $35 per barrel for its pre-salt fields, the country still relies on oil for 40% of its exports, and a price collapse would hit government revenues hard, especially with public debt at 78% of GDP in 2024.
Then there’s Canada’s oil sands producers, like Suncor or Canadian Natural Resources. Oil sands extraction is expensive—breakeven costs can hit $50-60 per barrel—and many of these companies carry significant debt from expansion projects. A prolonged price war could force them to shutter operations or default on loans, handing market share back to the Saudis. Russia could feel the heat as well. While their production costs are lower—around $20-30 per barrel—they’re heavily dependent on oil revenue to fund their budget, especially with Western sanctions already squeezing their economy in 2024. A price drop to $30 would strain their finances further, potentially forcing them to cut production or face domestic unrest. Even some U.S. shale players remain vulnerable. While the industry has consolidated since 2020, smaller firms with higher debt loads—like those in the Permian Basin—could go under if prices fall below their $40-50 breakeven point again. Saudi Arabia knows this. The 25% drop in oil prices to $63.83 in Trump 2.0 is already putting pressure on these high-cost producers, and if Trump 2.0’s trade wars signal a deeper growth slowdown, the Saudis have every reason to double down: flood the market further, crash prices to $30 or below, and let the high-cost producers—U.S. shale, Nigeria, Colombia, Brazil, Canada, Russia—feel the pain.
Now, consider the U.S., which became the world’s largest oil producer during Trump 1.0, pumping over 13 million barrels per day by 2020. Trump’s administration pushed for even more production, a policy likely to continue in Trump 2.0. This adds a new layer to the game. The U.S. isn’t just a competitor; it’s a resilient one, with shale producers who can ramp up quickly when prices recover. But they’re still vulnerable to price crashes—many smaller firms went bankrupt in 2020 when oil hit $20. With WTI now at $63.83 in April 2025, down 25% from its early 2025 peak, a new price war could already be underway, especially with the U.S. producing at record levels and adding to global supply.
Noise vs. Signal
So what’s the takeaway? Trade wars are messy. They rattle cages, spike volatility, and make for great headlines. But the charts tell a story. During Trump 1.0, the S&P 500 and Nasdaq weathered the storm, gaining 58% and 116% respectively despite 20-30% drawdowns, and hit new highs. The dollar stayed steady against major currencies, trading between 90 and 100 on the DXY, but pummeled emerging markets, with currencies like the MXN, COP, and KRW devaluing 20-40%. Oil swung wildly, from $70 to below zero and back to $40, reflecting growth fears and Saudi Arabia’s strategic moves. In Trump 2.0, the SPY and Nasdaq are already down 20% from their peaks of 600 and 20,000, showing the trade wars are biting again, while oil prices have dropped 25% to $63.83 by April 2025.
We’re lost in a narrative that trade wars will tank the U.S. economy, burst the tech bubble, and drag us into a recession. But the data from Trump 1.0 says the U.S. markets can handle the heat, even if it gets bumpy. Trump 2.0 is testing that resilience with 20% drawdowns already, and if the Trump 1.0 currency pattern repeats, we could see a very strong dollar against emerging market currencies, putting countries like Mexico, Brazil, Colombia, and South Korea under renewed pressure. Oil, meanwhile, is a wildcard—Saudi Arabia’s game theory could spark another price war, putting players like Nigeria, Colombia, Brazil, Canada’s oil sands, Russia, and even some U.S. shale firms in serious trouble. As Trump 2.0 unfolds, let’s keep our eyes on the charts and the data. The real story isn’t in the panic of the moment—it’s in the perspective the numbers provide.
Thanks for reading,
Guillermo Valencia A
Cofounder of MacroWise
April , 09 2025
Muchas gracias por escribir