


The Visible Hand
When liquidity is high, the market’s DJ spins tracks like Fatboy Slim’s “Right Here, Right Now” an infectious beat that gets the crowd moving, signaling it’s time to dance with the odds in your favor.
Adam Smith spoke of the "invisible hand," that mysterious force which, according to him, guides the selfish actions of individuals toward a greater good, as if the market had a wisdom of its own. But what if, in financial markets, there were another hand—one we can see, measure, and feel? A hand that doesn’t operate in the shadows but becomes evident in the numbers and trends. I believe that hand exists, and its name is liquidity.
Liquidity—the ease with which we can buy or sell assets—is the current that drives markets. It’s like the water level in a river: when it flows abundantly, boats sail smoothly; when it dries up, rocks emerge, and the journey becomes dangerous. I recently conducted an experiment to test this, and what I discovered is that liquidity doesn’t just affect how markets move—it literally shapes the probabilities of what we can gain or lose. It’s the visible hand that decides whether the odds are in our favor or against us.

The Experiment: Peering Under the Hood
To understand this, I took market return data and divided it into two worlds: periods of high liquidity and periods of low liquidity. Then, I plotted probability distributions—those graphs that show how likely it is to achieve a positive return or suffer a painful loss. The results were like turning on a flashlight in a dark room.
During periods of high liquidity, the distributions showed a positive skew. Imagine a curve tilting to the right, with a long, generous tail of positive returns. The average sat comfortably in positive territory, and extreme negative events were rare, as if the market were saying, “Come, play—the odds are in your favor.” For example, in one of my graphs—the daily returns during a liquid period—the distribution is almost a symmetrical bell curve with a slight nudge toward the positive, with an average return of 0.06%. It’s not a fortune in a day, but multiply that by thousands of days, and the picture changes.
In contrast, during periods of low liquidity, the story shifts. The curve twists to the left, with an ugly, heavy tail of extreme losses. The average sinks, and catastrophic events become more common. In my graph of annual returns during a dry period, the negative skew is clear: although the average reaches 13.47% thanks to a few good years, the shadow of drops as steep as -40% looms in the background. And if we look at an entire decade with low liquidity, the message is even starker: “It’s not a fruitful decade,” as the saying goes. The music stops, and those who keep dancing do so at their own risk.

Nasdaq returns probability distribution in a low liquidity environment.
The Graphs: A Window into the Market’s Soul
Let me tell you about the graphs I prepared, because they’re like maps showing us where the treasure lies and where the cliffs drop off.
Daily Returns: Here, the distribution is tight and nearly symmetrical, like a well-tuned bell. With high liquidity, the peak is near 0%, but with a slight nod toward the positive (0.06%). It’s the market in calm mode: no big surprises, but the odds are slightly in our favor.
Monthly Returns: Things get more interesting. The curve widens and begins to tilt to the right, with an average of 1.23%. There’s more room for gains, but also for losses. It’s as if liquidity is saying, “I’ll give you more rope, but be careful not to tangle yourself.”
Annual Returns: Now the distribution stretches like an accordion. With high liquidity, the average jumps to 15.47%, and the right tail extends toward juicy gains, while extreme losses lag behind. It’s the market in full party mode: when there’s liquidity, everyone wants to dance.
Decadal Returns: This is where the visible hand shows itself in all its splendor. In a liquid period, the average skyrockets to 361.95%, and the distribution is a victory cry: a curve that climbs toward massive returns and barely looks back. Extreme losses are a distant echo. It’s a fruitful decade, where liquidity kept the music playing.
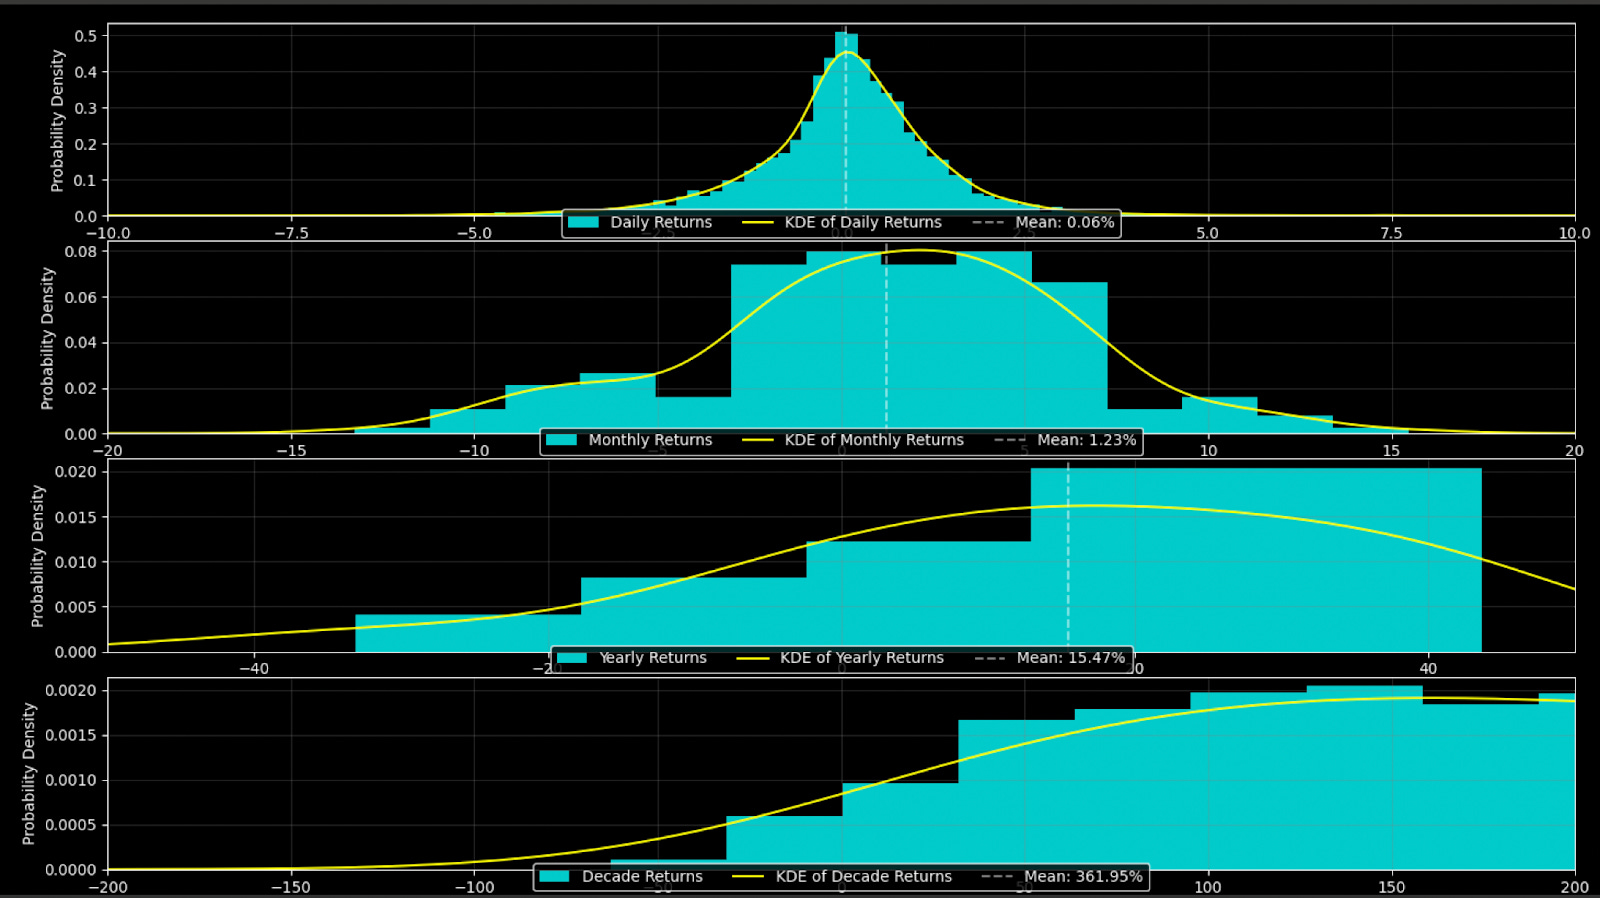
Nasdaq returns probability distribution in a high liquidity environment.
When liquidity rises, the distributions sweeten; when it falls, the market sours.
What Does This Tell Us?
Liquidity is like the market’s DJ: when it plays good music, everyone dances, and the probabilities tilt in our favor. When the power cuts out, chaos reigns, and losses loom. Look at 2008, for example: liquidity plummeted, and with it came historic crashes. Compare that to the post-crisis boom or the 90s, when money flowed like a swollen river, and returns smiled back.
For investors, this is a compass. If liquidity is high—if the global index is climbing toward 80—it’s time to take a bit more risk; the odds are on your side. If it dries up—if it drops to 20—maybe it’s better to sit and wait for the music to return. Because those probability distributions don’t lie: they’re the X-ray of opportunities and risks.
The Hand We Can Touch
Adam Smith was right that forces guide markets, but not all are invisible. Liquidity is the visible hand, molding the probability curves and deciding whether the market embraces you or pushes you to the brink. My experiment confirms it: when liquidity flows, the skew is with us; when it’s scarce, extreme events punish us, and decades turn barren.

So, the next time you’re thinking about investing, don’t just look at prices or headlines. Look at liquidity. Listen for the music. When liquidity is high, the market’s DJ spins tracks like Fatboy Slim’s “Right Here, Right Now” (listen here)—an infectious beat that gets the crowd moving, signaling it’s time to dance with the odds in your favor. But when the music fades, it’s your cue to step off the floor and wait for the next set. Because that visible hand is the one that will tell you whether it’s worth dancing or staying on the sidelines.
Thanks for reading,
Guillermo Valencia A
Co-founder MacroWise
April 27 , 2025
then, the first thing that comes to mind is, this very fast leads to "learning to predict the behavior of liquidity, becomes the skill of desire", no? - specially if the 'hand' shows its handling over the market in decades, otherwise you'd be like astronomers, looking at the past ...