


Why Bitcoin will exceed 50,000 USD and Gold will climb to 3,800 USD in the next 4 years
“Tools are better than models. I often think in a world that is non-linear and full of self referential data.” James Leitner. President of Falcon Management.
The global economy of today is filled with uncertainties nearly everywhere you look. While leading economic indicators coming out of the US remain good for now, growing tensions, trade wars and geopolitics leave many investors feeling uneasy. At Macrowise, we believe bubbles are forming on the global landscape across multiple asset classes and trading during this cycle could be treacherous, but that doesn’t mean there aren’t investment opportunities. Macrowise has developed a framework that attempts to show the current state of stocks and predict how they will transition through four specific phases as follows:
Rockstars: These are stocks that we believe could continue moving higher and even go parabolic. If we are indeed in the final stages of this bull market, these are the stocks primed to push to new all-time highs in the next 6 months.
Icarus: Some of them are market darlings. However, our models indicate that they are bubbles crashing, or on the verge of a crash. Many used to be monopolies or industry leaders, but are now facing increased competition or new regulations.
Zombies: These stocks are trapped in a trading range or unable to rally. Policy makers interrupted the Schumpeterian creative destruction process, creating zombies that only survive with stimulus.
Gems: Very depressed assets that may be on the verge of starting a new bull market. Contrary to the zombies, there are game changing events in the near term that could trigger a new bull market.
The returns of these 4 categories have very different stochastic patterns. Every single category is also easy to monitor from a fundamental level. The model shows there is a transition probability among categories. For example, the most probable transition of an Icarus is to transform into a Zombie (90%). The most probable transition of a Rockstar is to carry on (90%) until it becomes an Icarus (10%). The most probable transition of a Zombie is to stay a Zombie (90%), unless a drastic change occurs and it can find a new home as a Gem (10%). The most probable transition of a Gem is to evolve into a Rockstar (90%).

From our model, the most intriguing assets, or those with the best risk/reward profile are the Gems. These are the assets that we believe are ripe to make the leap towards becoming a Rockstar and have a lot of upside potential.
Characteristics of a Gem
A Gem is a highly volatile asset, depressed in value and there is in general less understanding about the asset.
A Gem is viewed as highly speculative and susceptible to a lot of manipulation.
A Gem also has a high probability of transforming into a Rockstar creating a massive investment opportunity.
→ 2 Of Our Current Favorite Gems Are: Bitcoin and Gold ←
To implement our strategy, we need two tools:
Scale: A framework to understand the change in scale.
Short Term Risk Management Tool to surf the short term volatility that could kill us.
Scale
Framework 1: Schopenhauer’s idea about truth.
All truth passes through three stages. First, it is ridiculed. Second, it is violently opposed. Third, it is accepted as being self-evident.
Framework 2: Rene Girard’s concept of the scapegoat.
When there is a huge state of tension between powerful groups of interest in our society, the solution is not a linear agreement where the different parts follow a kind of Rousseau social contract. The solution is non-linear. The group of interest releases this tension in the form of scapegoat.
Negative interest rates create an incentive for big tension between important groups of society, corporations and populists. Negative interest rates increase the power of corporations, but inequality populists fight the power of corporations.
A loose monetary policy favors the corporations, while expansionary fiscal policy favors the power of the populist. Both policies produce economic growth, but they deteriorate the purchasing of the fiat currency. The first losers are tier 1 banks and emerging market central banks. In the end, the big losers are the emerging market citizens.
While corporations and populist movements are at odds, they are together in their fight against China and the communist state’s control of tech companies. They must work together in order to survive.
The losers in this scenario, emerging market citizens and holders of these emerging market currencies, will look for alternatives to protect themselves from government control and corporations. One of the most interesting ways to combat this is with Bitcoin.
So, the big scapegoat will be the central banks and fiat money! When people realize that scarcity will be one of the most valuable characteristics of money, the demand for this asset will be huge. So, our scale idea is scarcity.
We are certain that Bitcoin is the first, scarce, digital currency that the world has ever scene. Drawing on resources from the cryptocurrency community, we have identified a new model for valuing the future of Bitcoin. Source: Modeling Bitcoin's Value with Scarcity
How to measure scarcity
https://medium.com/@100trillionUSD/modeling-bitcoins-value-with-scarcity-91fa0fc03e25
“A stock flow (SF) model is the best way to measure scarcity. Stock is the size of the existing stockpiles or reserves. Flow is the yearly production. Instead of SF, people also use the supply growth rate (flow/stock). Note that SF = 1 / supply growth rate.
Let’s look at some SF numbers of other monetary commodities:

Gold has the highest SF at 62, meaning it takes 62 years of production to reach the current gold stock. Silver is second with SF 22. These high stock flows make them monetary goods. Palladium, platinum and other commodities have a SF of barely higher than 1 or less. Existing stock is usually equal to or lower than yearly production, making production a very important factor. It is almost impossible for commodities to get a higher SF, because as soon as somebody hoards them, the price rises, leading to a rise in production, causing the price to fall again. It is very hard to escape this trap.
Bitcoin currently has a stock of 17.5 million coins and a supply of 0.7m/yr, which equates a SF of 25. This places Bitcoin in the monetary goods with silver and gold. Bitcoin's market value at current prices is $145 billion.
The supply of Bitcoin is fixed. New Bitcoins are created in new blocks. Blocks are created every 10 minutes (on average), when a miner finds the hash that satisfies the PoW required for a valid block. The first transaction in each block, called the coinbase, contains the block reward for the miner that can be found in the block. The block reward consists of the fees that people pay for transactions within that block and the newly created coins (called subsidy). The subsidy started at 50 bitcoins, and is halved every 210,000 blocks (about once every 4 years as of now). That's why 'halvings' are very important for Bitcoin’s money supply and SF. Halvings cause the supply growth rate (in Bitcoin context usually called 'monetary inflation') to be stepped and not linear.
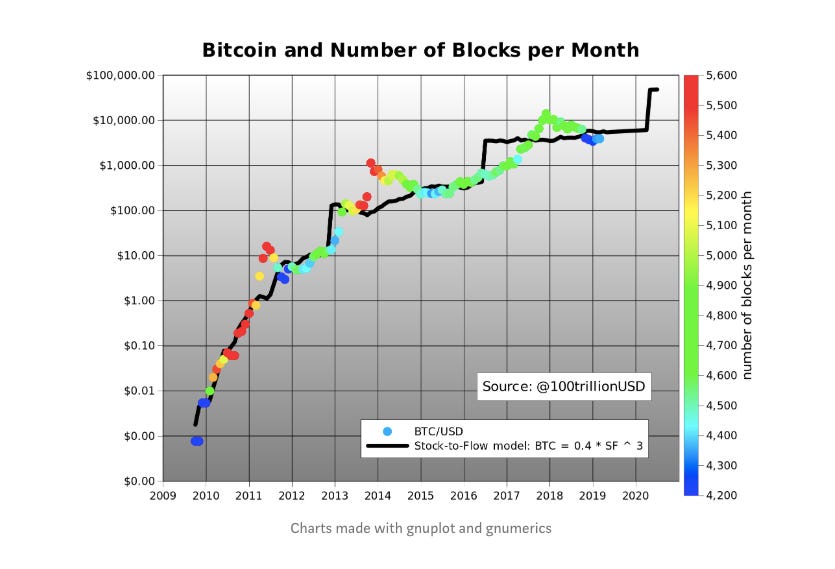
A scatter plot of SF vs. market value shows that it is better to use logarithmic values or axis for market value, because it spans 8 orders of magnitude (from $10,000 to $100bn). Using logarithmic values or axis for SF as well reveals a nice linear relationship between ln(SF) and ln(market value). Note that I use natural logarithm (ln with base e) and not common logarithm (log with base 10), which would yield similar results.

Charts made with gnuplot and gnumerics
Fitting a linear regression to the data confirms what can be seen with the naked eye: a statistically significant relationship between SF and market value (95% R2, significance of F 2.3E-17, p-Value of slope 2.3E-17). The likelihood that the relationship between SF and market value is caused by chance is close to zero. Of course other factors also have an impact, including: price, regulation, hacks and other news. That is why R2 is not 100% (and not all dots are on the straight black line). However, the dominant driving factor seems to be scarcity / SF.
What is very interesting is that gold and silver, which are totally different markets, are in line with the Bitcoin model values for SF. This gives extra confidence to the model. Note that at the peak of the bull market in December 2017, Bitcoin SF was 22 and Bitcoin market value was $230bn, very close to silver.
Because halvings have such a big impact on SF, I put months until the next halving as a color overlay in the chart. Dark blue is the halving month, and red is just after the halving. The next halving is expected in May 2020. The current SF of 25 will double to 50, moving it closer to gold (SF 62).
The predicted market value for Bitcoin after the May 2020 halving is $1trn, which translates to a Bitcoin price of $55,000. That would be quite spectacular. Time will tell and we will know more of this hypothesis and model in one or two years after the next halving. ”
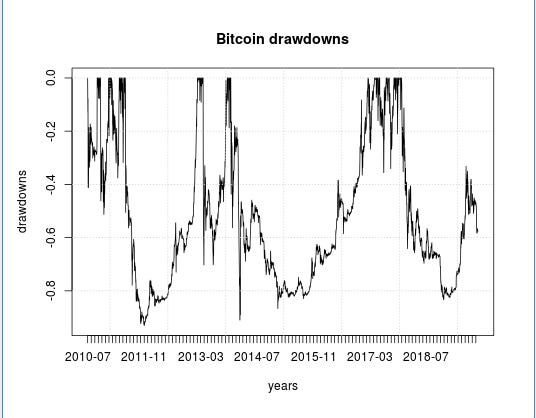
The drawdown model is also indicating a transition from Gem to Rockstar that is consistent with the former model:
Bitcoin will have a SF of 50 while Gold is around 60.
These two assets are prompt for a change in scale. Following this model, our BTC target price is 50,000 USD and 3,800 USD for Gold. The bull market in gold began in 2000 and we believe it is primed for another scale up in the next few years.

If we analyze the drawdons, we see Gold is in a rockstar pattern. The 2013 drawdown is similar to the 1974 drawdown.

We are expecting new all-time highs in both Bitcoin and Gold within the next few years.
Guillermo Valencia A
Director of Macrowise
Florianópolis, Brazil
October 9th, 2019
This content is only for educational purposes, is not in any form an investment advisement. This report has been published by MACROWISE for distribution to market professionals and institutional investors. It should not be considered as investment advice or a recommendation to purchase any particular security, strategy, or any investment product. References to specific securities are not intended to be and should not be interpreted as recommendations to buy or sell such securities. Information contained herein has been obtained from sources believed to be reliable, but not guaranteed.